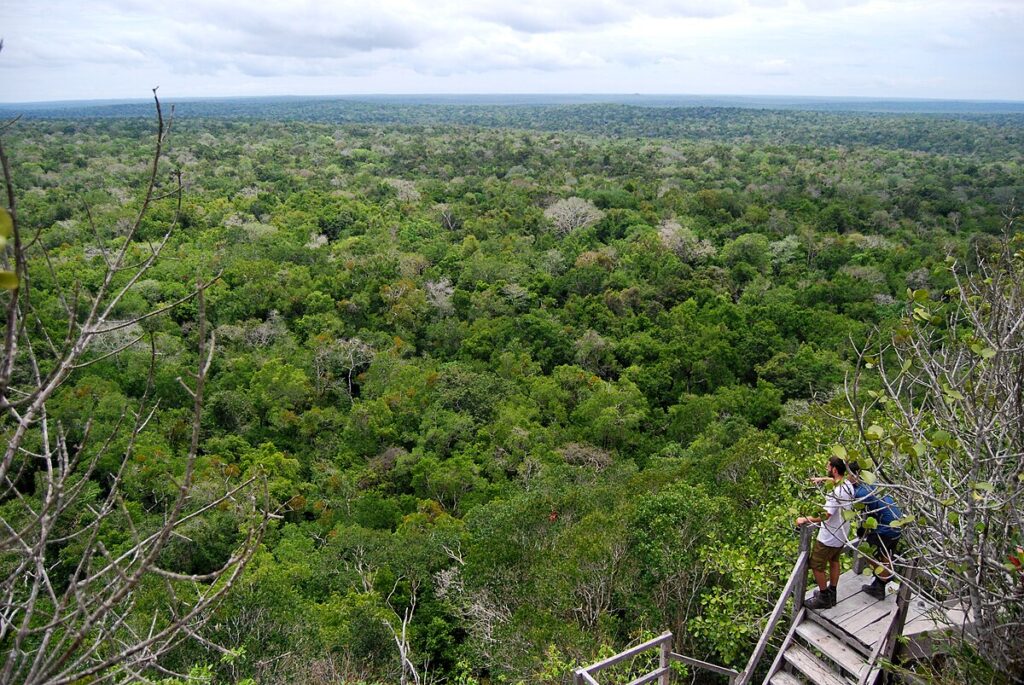
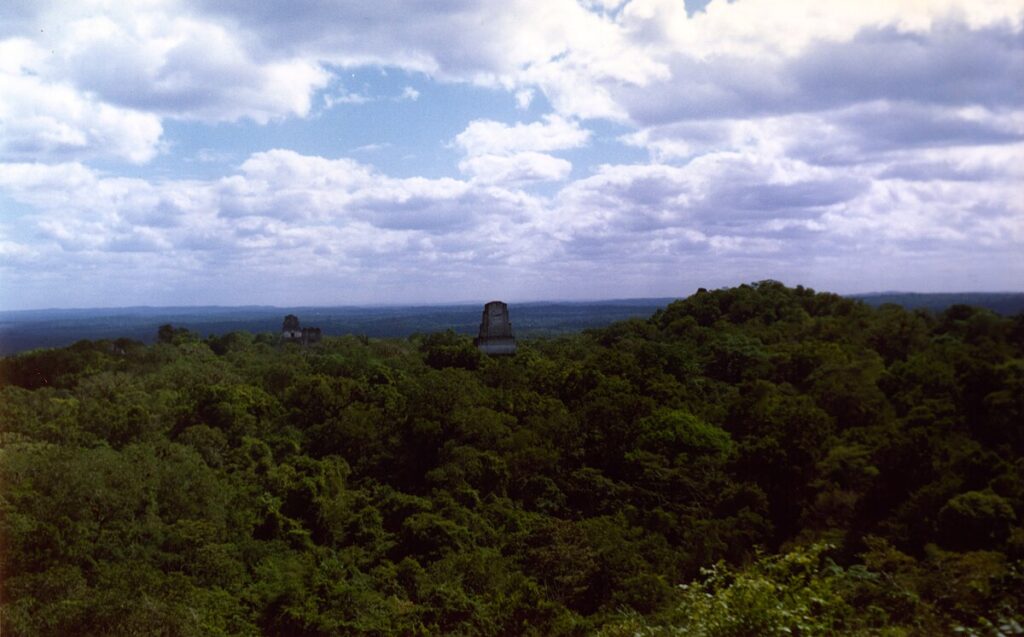
In northern Guatemala, the jungle still swallows sound. Helicopters pass, cicadas resume their pulse, and then the canopy closes over again. Yet on a scientist’s screen the undergrowth falls away in seconds. Laser pulses sweep the forest and return a clean, bare-earth model. Lines sharpen into streets. Mounds resolve into platforms. A city plan appears where the eye saw only leaves.
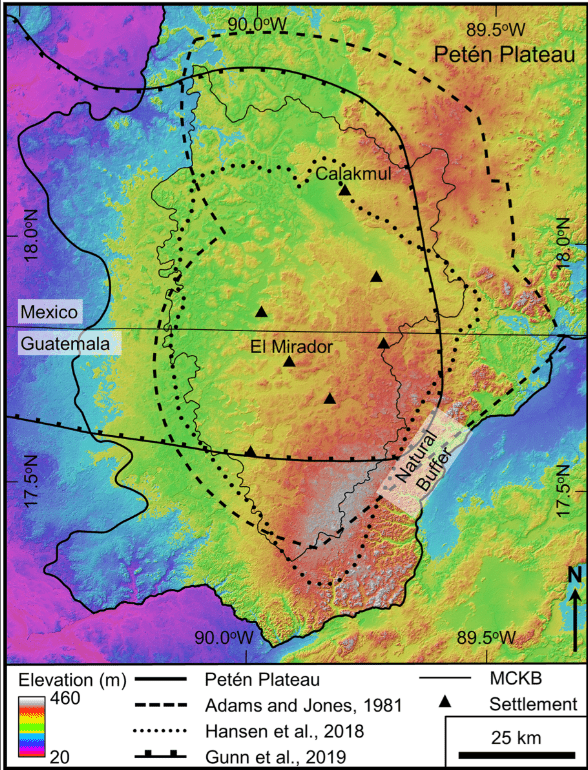
That city is part of a much larger pattern. Airborne surveys across the Mirador-Calakmul Karst Basin (MCKB) have mapped hundreds of ancient settlements stitched together by raised causeways. Many belong to the Preclassic era, centuries before the great Classic capitals flourished. The picture that emerges is not a scatter of hamlets but a connected landscape of civic centres, waterworks and engineered fields—substantial, organised, and old.
What LiDAR actually does for jungle archaeology
LiDAR—light detection and ranging—fires rapid laser pulses from a plane or helicopter and measures their return times. Most hits bounce off leaves. Enough reach the ground that, after careful filtering, archaeologists can generate a digital surface stripped of vegetation. From that “bare-earth” model, shaded reliefs bring out ridges, depressions, terraces, dams, roads and masonry platforms. The method is fast, consistent and, crucially, sees through canopy where walking surveys struggle.
In the MCKB, teams processed the data at half-metre resolution and classified returns to separate canopy from soil. The result is a regional map with house-mounds and monumental cores shown together. You can follow a causeway for kilometres without leaving your chair.
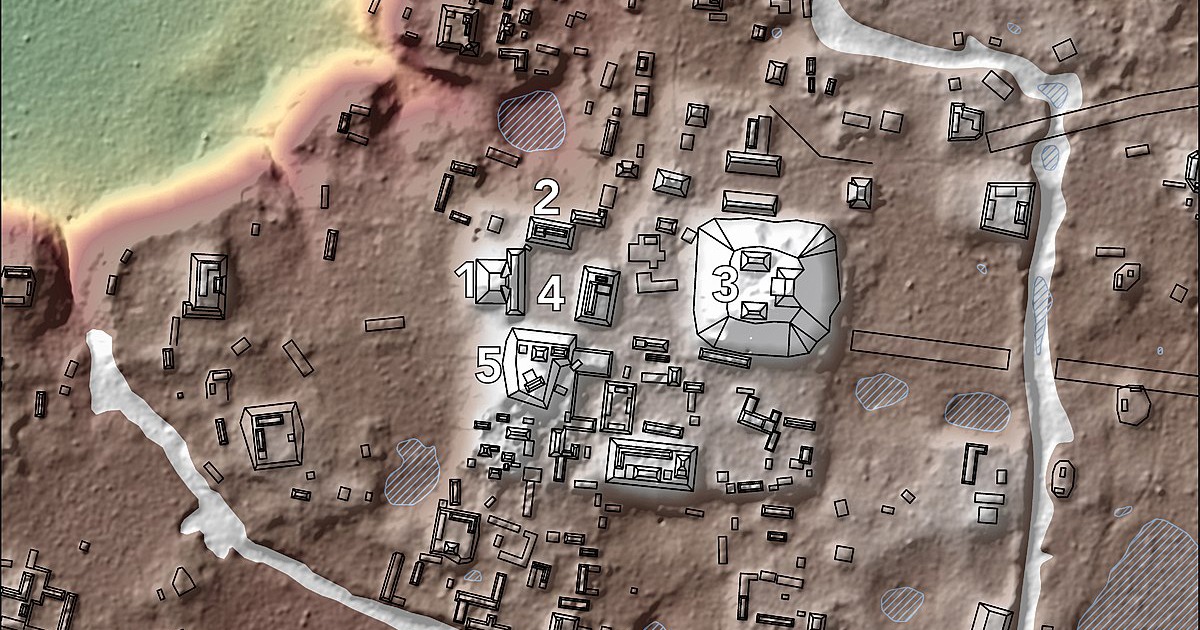
A city plan under the leaves
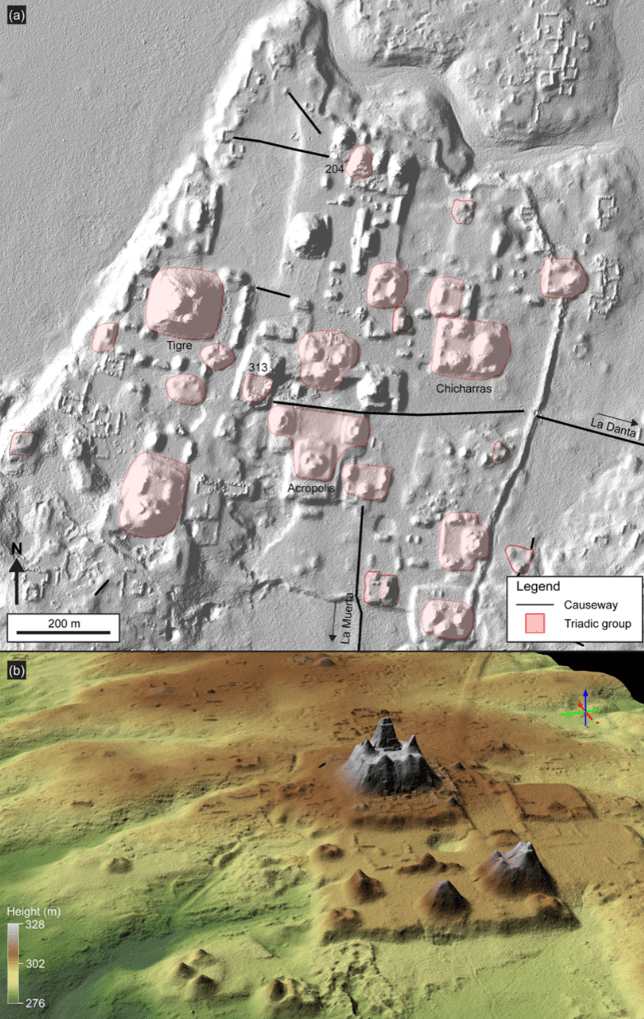
Take one of the newly mapped centres in the basin. At its heart stand triadic complexes—three pyramidal mounds set on a shared platform—arranged to command broad plazas. Nearby, an E-Group frames the horizon for solar observation. Around these, house-mounds sprawl in ordered clusters, separated by lanes and drainage. On the margins, earthworks manage water: channels, berms, artificial basins. From this core, a raised white road—the sacbe—runs straight towards a neighbour, linking communities that traded, intermarried and shared ceremonies.
These forms belong to a Preclassic world that had already mastered scale. The architecture speaks of pooled labour, formal leadership, and a calendar that set the tempo of work and worship. The roads speak of coordination beyond a single town. And the waterworks remind us that ingenuity often begins with the unglamorous problem of storage and flow.
From “isolated ruins” to a connected lowland
For much of the twentieth century, lowland Maya sites were treated as islands in a green sea. LiDAR has forced a different metaphor. The mapped landscape looks like a web: nodes of architecture tied together by arteries of stone. Survey after survey shows the same grammar—plazas, triads, E-Groups, dams—repeated across districts. In northern Guatemala alone, researchers condensed hundreds of settlement clusters into more than four hundred cities, towns and villages, linked by over one hundred and seventy kilometres of raised roads.
Numbers matter here not as trivia but as a check on imagination. The volumetrics of platforms and pyramids imply massive quantities of fill. The length and width of causeways indicate design standards. The capacity of reservoirs points to dry-season planning. When you aggregate these across a basin, you get the outline of administration: who could command labour, how far authority reached, and where borders hardened.
How researchers verify a “discovery” made from the air
LiDAR does not excuse spadework. It directs it. Teams test the models on the ground: a line on a hillshade becomes a trench across a suspected wall; a bright mound on a slope becomes a test pit in household fill; a rectilinear depression becomes a cut through a reservoir berm. Sherds secure dates. Floors and sealing layers confirm sequences. As seasons pass, the picture from the air is checked, corrected and extended by stratigraphy and artefacts.
This back-and-forth matters because jungle relief can mislead. Roots mimic lines. Erosion softens corners. Looters leave scars that mimic cuts. A careful workflow—air, then ground, then air again—keeps enthusiasm honest and lets researchers scale from a promising cluster to a reliable map of an entire district.
Why a Preclassic city in Petén matters now
It changes the timeline. The Preclassic, once painted as a long prelude, now reads as a period of fast innovation and regional coordination. Monumental buildings and formal planning appear earlier than textbooks implied. Causeways show that planners thought beyond a single centre. Water systems show that climate risk was managed in stone and soil.
It also shifts the conversation about population. Dense settlement around civic cores, plus intensive terracing and bajos converted to fields, point to far more people on the landscape than older models allowed. That, in turn, reframes debates about sustainability, forest use, and the kinds of political institutions capable of organising work at that scale.
Streets, reservoirs, calendars: the texture of daily life
Walk the model with a human in mind and the abstractions thin. A passer-by would feel the rise from domestic lanes to the plaza’s open floor. He would see stairways that coaxed a slow procession to the temple top. He would cross a causeway raised just enough to keep feet dry after rain. The city’s plan choreographed movement, time and attention.
None of this denies change. Some centres grew, paused and grew again. Others faded quietly. LiDAR preserves both—the grandeur and the quiet endings—because it maps the bones of layout rather than the glamour of painted plaster. Even worn-down mounds keep their form when the forest forgets their colour.
Method in brief: how the numbers stack up
Survey flights covered a broad swath of northern Petén at high density, delivering ground returns accurate to decimetres. Analysts filtered the clouds with open and proprietary tools and produced digital elevation models at 0.5-metre resolution. From those, they measured platforms, traced roadbeds, calculated reservoir capacities and compared architectural formats across sites. The regional synthesis condensed hundreds of clusters into tiered site hierarchies and tallied causeway lengths to show how centres related and where corridors of traffic likely ran.
Those figures come with caveats. A DEM does not give a date. A mound’s volume hints at labour yet does not tell you who paid, who directed, or how long a season lasted. Even so, when you combine the models with excavations and ceramics, a strong outline appears: large, early cities linked by engineered roads and water systems, all working within a karstic basin that both constrained and enabled growth.
Conservation stakes in a mapped landscape
Maps are not neutral. They guide both research and policy. In the Maya Biosphere Reserve, a good LiDAR layer helps rangers and communities plan patrols, route trails and rank threats. It also sharpens debates about development: where roads should not go, which wetlands should remain intact, and how tourism can be channelled to avoid fragile architecture.
It also brings local history closer to those who live with it. Communities across Petén already carry the heritage of the region in language, craft and memory. A model that shows the city under the leaves is not just a tool for scholars; it is a prompt for schools, guides and regional museums.
What sets this “lost city” apart
Every centre has quirks. One may favour triadic groups arranged in a chain. Another may build its reservoir system as nested basins. A third may run a sacbe arrow-straight through bajos that flood in the rains. In the new maps, these preferences become comparable. Planners copied, adapted and sometimes over-ruled local terrain to get the effect they wanted. Over time, styles converge and diverge in waves you can see from the air.
The Guatemalan basin is especially telling because many of its centres are early. We are looking at experiments close to the start of a tradition. That makes the evidence precious. It shows how quickly complexity took hold and how far cooperation extended before the Classic period’s famous dynasties.
Field seasons that follow the pixels
Once the models are in hand, a season on the ground works like a checklist. Teams cut narrow transects to confirm a wall here, a stair there. They core reservoir floors to find silts, pollen and charcoal. They sample house-mounds to build a picture of diet and craft. They trace causeways at ground level to record paving and alignments. Step by step, the air’s big picture acquires texture: dates, materials, repairs, even episodes of deliberate demolition.
Because the data covers such wide areas, archaeologists can also test ideas at regional scale. Do E-Groups appear first in particular corners of the basin? Do triadic complexes cluster near wetlands? Does causeway width correlate with the size of civic cores? Questions that once required decades of foot survey can now be posed, and partly answered, inside a single project window—and then refined on the ground.
What this means for visitors and the region
Visitors who make the trek to El Mirador, Nakbe or El Tintal meet two landscapes at once. There are the platforms, stairs and stelae in the heat and shade. And there is the ghostly second city, the one on a tablet, where every subtle rise is traced and every terrace line is clear. Guides increasingly carry both worlds. They can point from the screen to the horizon and back again. It makes the past less abstract and the present more anchored.
For the region, a clear map can support better infrastructure decisions and stronger protection for cultural and natural resources. It can also spread attention. Lesser-known sites gain visibility when they appear on the same network map as the giants. That, in turn, can help distribute tourism and research time more evenly, easing pressure on famous cores while widening the story told to visitors.
Key takeaways at a glance
LiDAR has given northern Guatemala a coherent archaeological map. It shows early, complex cities linked by engineered roads and water systems. It resets assumptions about when large-scale planning began. And it provides a practical tool for conservation and community projects today. The “lost city” is no longer a rumour; it is a plan you can scroll, measure and then walk.